

1. Introduction
2. Concept and Current Status of Satellite Based regional Area Survey Technology
3. Analysis of Regional Area Survey Technology
3.1 Analysis of Goyang City (Great Train Express) Subway
3.2 Analysis of Busan Metropolitan City Underground Road
3.3 Feasibility Study for Application to the Pohang Landfill Facility
3.4 Results Analysis and Discussion
4. Conclusion
1. Introduction
With the recent acceleration of the urban population concentration, various infrastructures within cities have become necessary for convenient living. Additionally, as surface space becomes saturated, public infrastructure facilities (e.g., transportation) are increasingly being moved underground, utilizing deep underground spaces for roads and railways. As urban populations become denser, low-rise residential areas are gradually transforming into high-rise buildings. Simultaneously, waste landfill facilities are being established to manage the increasing volume of daily waste. The urban changes resulting from the installation of these structures inevitably impact ground stability, including subsidence, and various technologies are being developed and applied to maintain city safety. The current process and framework used for infrastructure maintenance is based on a reactive repair and reinforcement approach for damaged parts of structures. However, there is a shortage of maintenance funds compared to the massive increase in aged structures, so application of an effective maintenance strategy and decision making is necessary (Oh et al., 2023). This is why we need to develop technologies that require less labor and are more cost-effective.
Among them is the use of satellites to survey regional areas. Various satellites have recently been utilized domestically and internationally. This study uses synthetic aperture radar (SAR) images by applying interferometric SAR (InSAR) techniques. Specifically, the number of satellites equipped with SAR radar has recently increased, and some satellites provide data for free, making them economically feasible. This study applies this technology for the maintenance of landfill facilities that have been left unmanaged over large areas.
In recent years, as SAR data has become easier to acquire, various studies have been conducted. Analyzing the Granada basin with InSAR revealed ground deformation caused by urban expansion and intensive water runoff, showcasing the possibility of measuring ground movement due to underground mining (Joaquim et al., 2010). A study of a 10 km railroad section in southern Italy using InSAR and GPR techniques demonstrated the ability of InSAR to detect hazardous points and enhance the efficiency of GPR data interpretation (Fabio et al., 2020). Utilizing multiple images for time series analysis can minimize the effects of multiple bands and different viewing angles through accurate downsampling of SAR data (Gui, 2010).
In Korea, there have been reports of InSAR applications in various facilities, such as urban centers, railways, and bridges. A GIS model has been proposed to identify subsidence initiation localities, serving as a useful tool for mine planners and developers for mine reclamation planning (Suh et al., 2010). The InSAR technique, which utilizes higher resolution SAR images with a small temporal baseline, is considered as a viable alternative to the traditional ground borne monitoring method for ground deformation monitoring in the fourth industrial era (Yoo, 2022). The D-InSAR technique effectively monitors short-term defor-mation in broad areas such as railway structures (Kim et al., 2022). D-InSAR (Differential Interferometric Synthetic Aperture Radar) is a technique that detects ground deformation or changes in terrain by comparing the phase differences between two satellite radar images taken at different times. This highlights its ability to interpret micro- displacements in high-speed railway bridges due to temperature and long-term deformation with improved InSAR monitoring (Kim et al., 2024).
In this study, the findings from previous studies are applied to a landfill facility that spans a regional area and is relatively difficult to manage. Landfill facilities in South Korea are regularly inspected to ensure their stability. During operation, inspections are conducted triennially, and after the landfill is completed, postclosure inspections must be conducted triennially for at least 30 years. However, after the landfill is closed, no revenue is generated from the facility to cover the costs of inspections and management activities. The ultimate aim of this study is to develop technology that enables cost-effective maintenance of such landfill facilities.
2. Concept and Current Status of Satellite Based regional Area Survey Technology
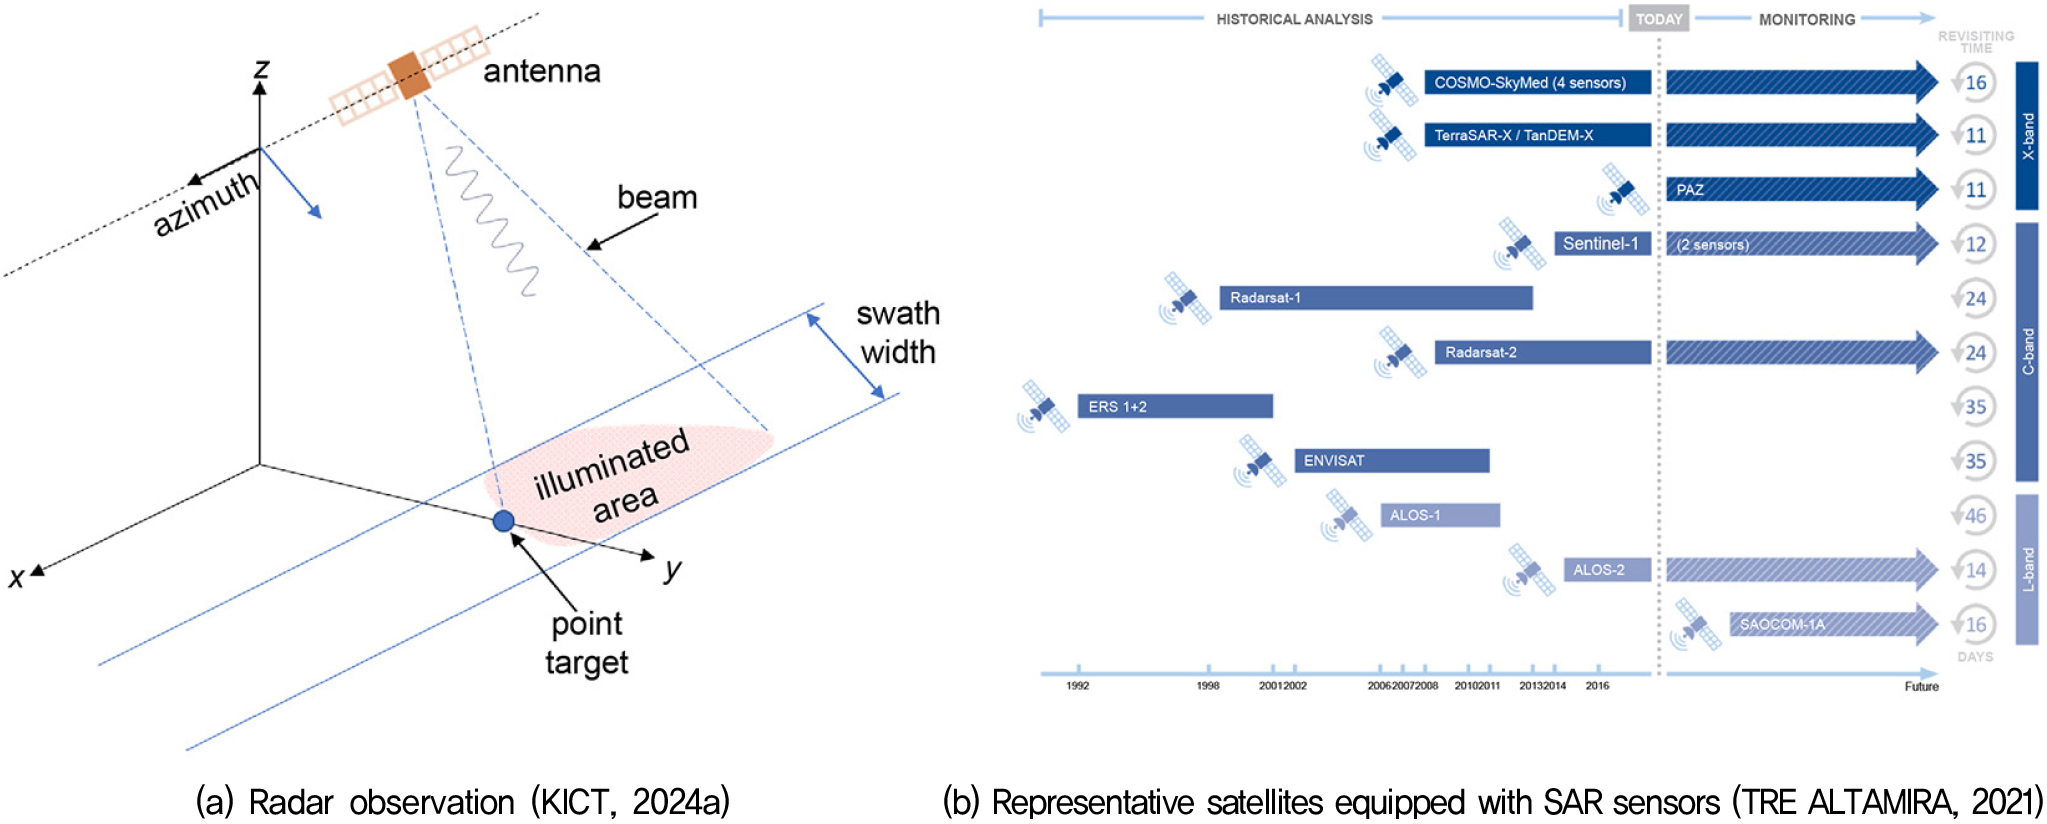
Satellite based SAR utilizes radar devices mounted on satellites to generate high-resolution images. As an active remote sensing technology, it uses microwaves ranging from a few centimeters to several tens of centimeters, allowing for observation under all weather conditions, as shown in Figure 1(a). The development of SAR satellites began with the U.S. SEASAT in 1978, which provided data. Following this, several satellites such as Almaz (Soviet Union/Russia), ERS-1 (Europe), JERS-1 (Japan), ERS-2 (Europe), and RADARSAT-1 (Canada) have orbited the Earth, equipped with radar sensors to provide SAR data [8]. Specifically, the Sentinel-1 satellites, operated by the European Space Agency (ESA) and widely used both domestically and internationally as of 2024, have seen the discontinuation of data provision from Sentinel-1B (as of December 23, 2021), with Sentinel-1C expected to be operational soon. Additionally, Hanwha Systems in South Korea is planning to launch and commercialize a microsatellite with SAR capabilities. A typical satellite with a SAR sensor is shown in Figure 1(b).
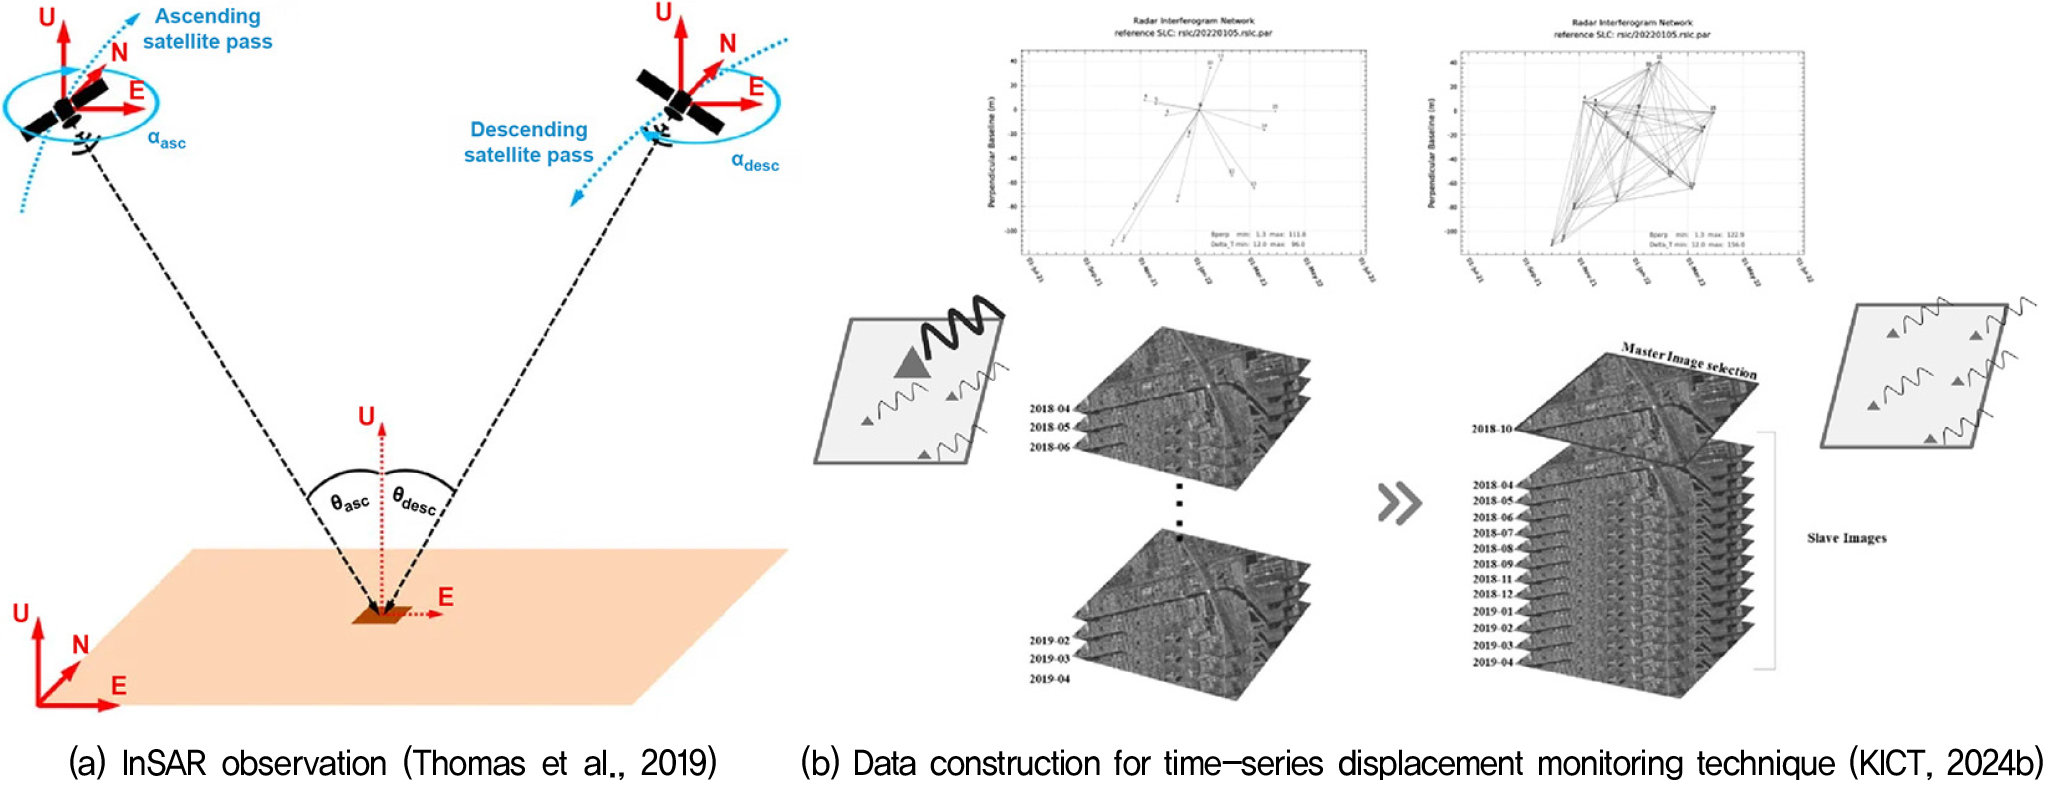
InSAR technology, as shown in Figure 2(a), uses the interference of radar waves reflected from the surface, where surface movement causes phase changes, generating interference patterns that allow for the calculation of surface displacement. To reduce errors when assessing ground displacement using SAR data, it is necessary to collect several images. For accurate time-series analysis, as shown in Figure 2(b), images must be acquired under consistent conditions (orbit, direction, observation polarization, and incidence angle). Proper alignment of the SAR images is essential before generating a differential interferogram, which removes topographic phase interference using a digital evaluation model (DEM) or digital surface model (DSM). In other words, DEMs and DSMs are representative models that serve as a baseline for fitting multiple data together consistently, as shown in b in Figure 2. DEM (Digital Elevation Model) represents the pure elevation of the ground surface, excluding features like buildings and trees, while DSM (Digital Surface Model) includes the total height of the surface, incorporating both the terrain and above-ground features.
Scatterers are broadly categorized into fixed scatterers and distributed scatterers, where a single scatterer within a pixel of a SAR image shows a strong scattering signal and provides a stable scattering signal over time, such as a transmission tower, building, or bridge. When multiple scatterers contribute to radar scattering in a single pixel of a SAR image, they are called distributed scatterers (DS). The time series LOS displacement of a surface is calculated using either a Permanent Scatterer (PS), which provides a stable backscatter signal in SAR imagery, or a Distributed Scatterer (DS), which is a collection of scatterers that contribute to radar scattering within a single pixel of the SAR image. Permanent Scatterer (PS) refers to individual objects, such as buildings or rocks, that consistently reflect radar signals regardless of time or environmental changes, whereas Distributed Scatterer (DS) represents areas where signals are collectively reflected from multiple weak scatterers on uniform surfaces, such as grasslands or soil.
Once sufficient high-accuracy data are collected, time-series radar interferometry based on fixed scatterers can be applied to identify displacement trends. If a significant accumulated displacement is detected, a detailed investigation can be conducted to determine the cause and implement preemptive reinforcement (Thomas et al., 2019).
3. Analysis of Regional Area Survey Technology
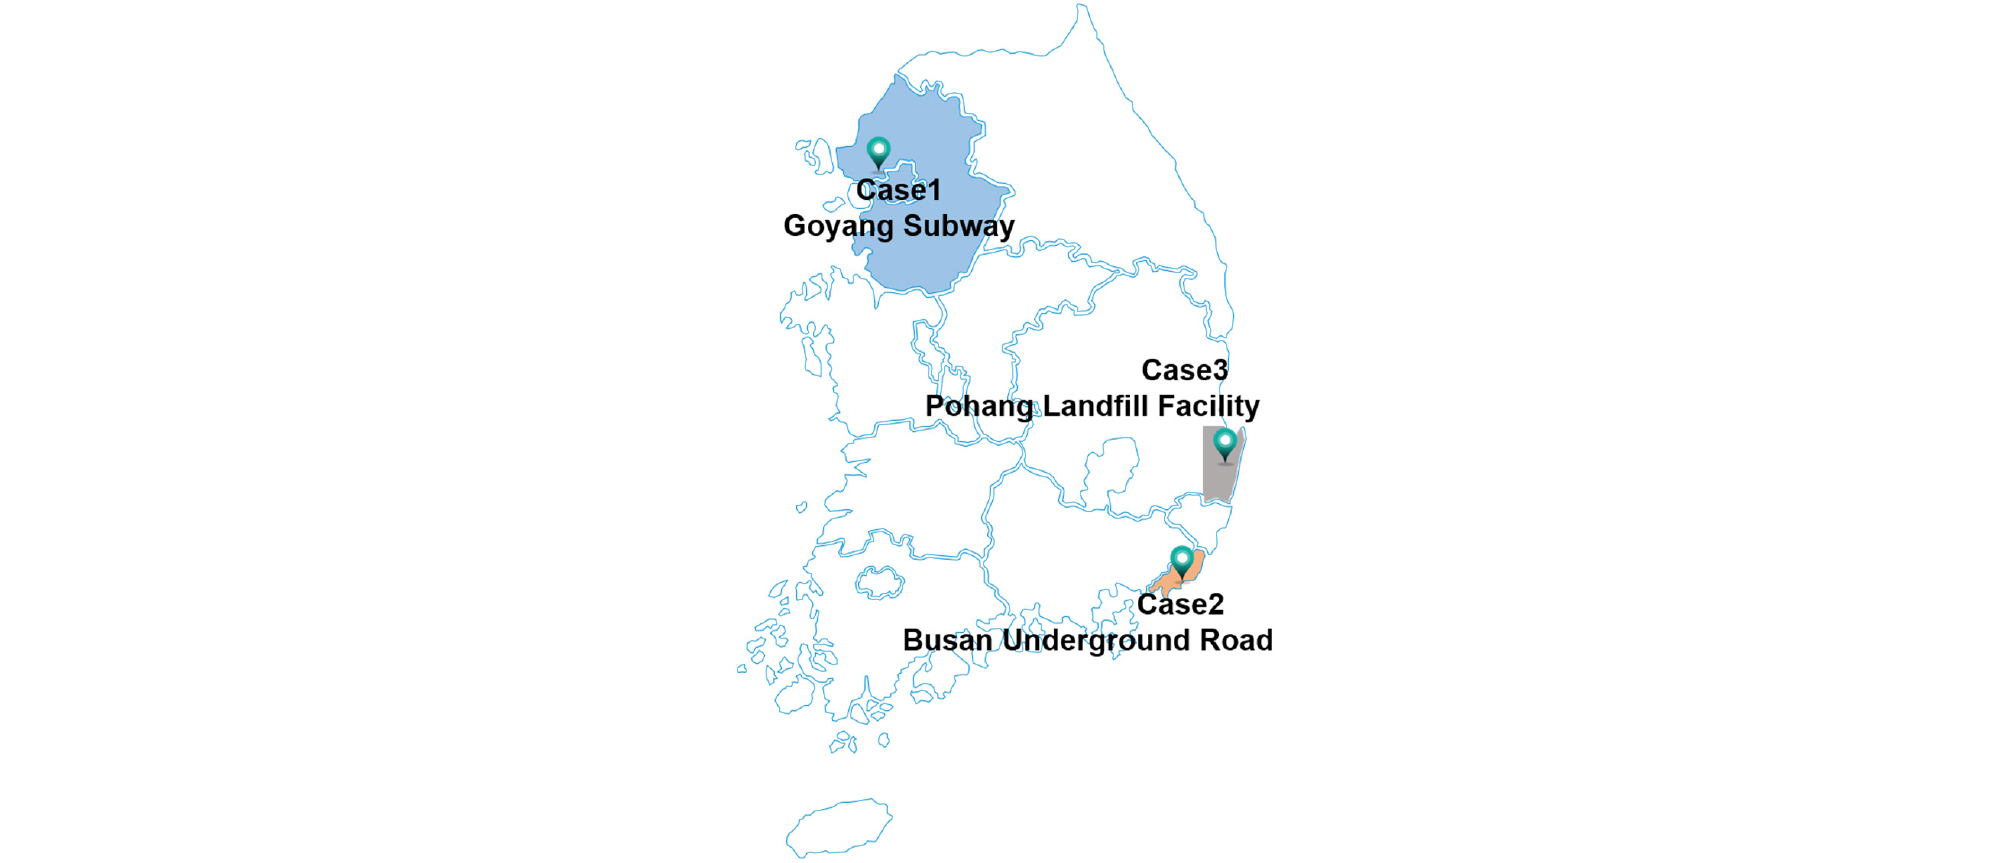
In this study, satellite SAR data was used to analyze terrain using InSAR (Imaging Radar Interferometry). The InSAR technique measures terrain elevation and ground displacement from the phase difference between two or more SAR images acquired under the same observation conditions over the same area. It accurately observes the ground displacement without being affected by atmospheric conditions, orbital information errors, or noise. This study analyzes the impacts on the land surface from the construction of underground structures in Goyang (Case 1), and Busan (Case 2), South Korea. In addition, this study analyzes the slope displacement trend of landfill facilities (Case 3) for its application to landfill facilities (Figure 3).
3.1 Analysis of Goyang City (Great Train Express) Subway
The analysis focused on the Goyang City section of the Great Train Express (GTX) subway, which connects Paju City to Hwaseong City (Dongtan) in the Gyeonggi Province of the Seoul Metropolitan area. Excavation for this route began in June 2019, and ground subsidence analysis was conducted for two periods: before and throughout the excavation period. A total of 163 Sentinel-1A images (Path 127, Frame 109) captured between February 2017 and June 2023 were collected and utilized.
Ground subsidence analysis was conducted on 57 Sentinel-1A images acquired before excavation started (February 2017 to June 2019). All Sentinel-1 SAR data were freely provided by the European Space Agency (ESA) and were used in this study. The SAR data were analyzed using the PS-InSAR method in Envi-SARscape 5.6 (Harris Geospatial Solutions, Inc.). PSInSAR (Persistent Scatterer Interferometric Synthetic Aperture Radar) is a technique that utilizes satellite radar data to precisely measure subtle ground displacements by analyzing stable scatterers, such as buildings or rocks, as reference points. The results showed the vertical displacement across the entire study area was near zero, indicating overall stable signals. However, localized displacement trends of up to 15 mm/year were observed in certain areas. Displacement exceeding 10 mm was observed near P1 in October 2018 and near P2 in April 2019.
Ground subsidence analysis using 163 Sentinel-1A images, including the post-excavation period (February 2017 to June 2023), revealed that vertical displacement across the study area remained near zero, indicating stable signals similar to the previous results. In Figure 4, P1 and P3 showed relatively stable displacement trends within ±5 mm and ±10 mm, respectively, similar to the previous analysis. However, at P2, a relatively large subsidence trend of up to 20 mm was observed before June 2019, and continued subsidence was noted afterward.

3.2 Analysis of Busan Metropolitan City Underground Road
The Mandeok–Centum Underground Expressway, a major crosscity road connecting east and west Busan, underwent an impact analysis that included ground subsidence due to excavation. For this analysis, 160 Sentinel-1A images (Path 54, Frame 111) taken between February 2017 and June 2023, were utilized. The analysis for the study area in this research was conducted using the same method as the analysis in Case 1.
The analyzed vertical displacement showed values near zero across the entire study area, indicating overall stable signals. Additionally, some areas exhibiting localized subsidence and uplift were identified, but the vertical displacement was relatively small approximately ±2.50 mm/year. In Figure 5, continuous subsidence was observed in areas P2 and P3, with surface displacement reaching up to 2.5 mm. In contrast, no distinct patterns of subsidence or uplift were identified at P1. Areas P2 and P3, which are on soft ground with alluvial clay deposits, may have been impacted by the construction of the underground expressway, necessitating onsite verification.

3.3 Feasibility Study for Application to the Pohang Landfill Facility
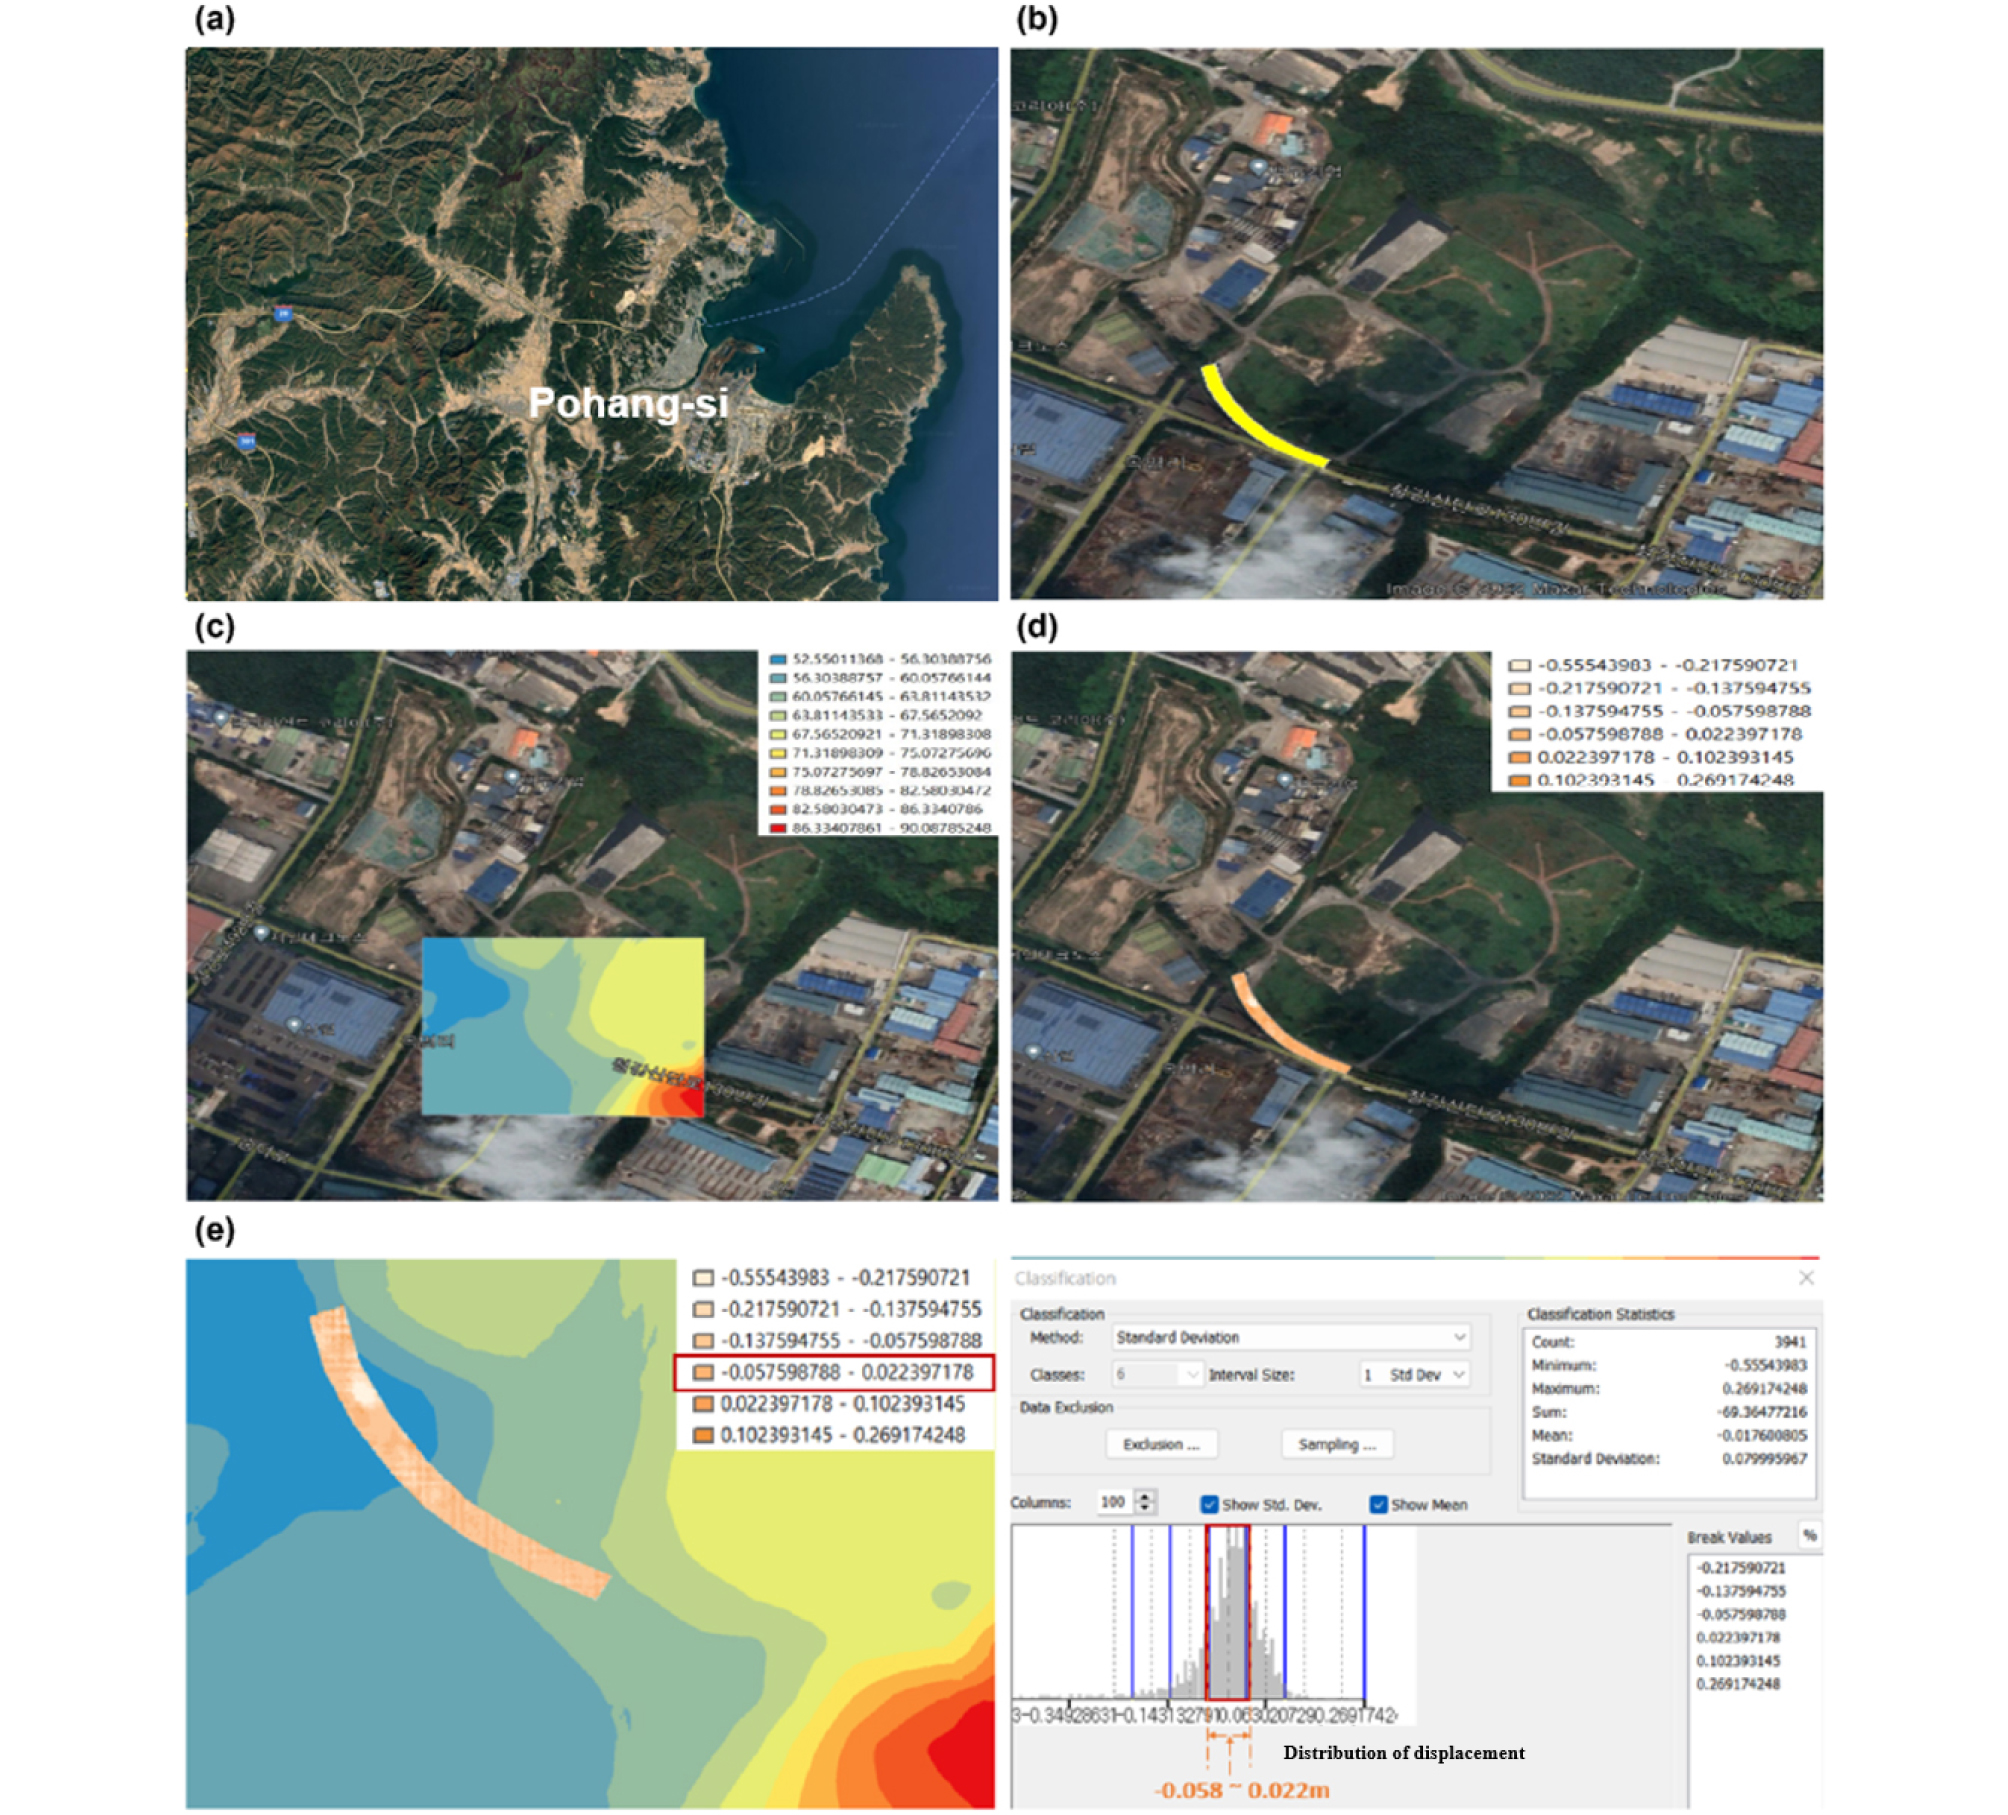
A semi-quantitative satellite image analysis was conducted to assess landfill embankment ground deformation over time, as shown in Figure 6. The analysis here is to verify the applicability of the landfill and utilizes time differenced elevation information from Google Earth rather than SAR data. Time lapse elevation data from 2007 and 2021, obtained from Google Earth Pro, were processed using ArcMap. A DEM for both years was created, and 3,941 points on the upper slope of the landfill road were analyzed for elevation changes. The analysis showed vertical displacement values on the slope ranging from (-)58 mm to (+)22 mm (KICT, 2022).
3.4 Results Analysis and Discussion
We analyzed the surface deformation patterns by using satellite SAR data for two regions where underground transportation infrastructure is being constructed. The analysis using satellite SAR data provided results that closely aligned with actual ground conditions and characteristics. To explore the application of this technology to neglected landfill facilities, we analyzed landfill sites using Google image data. The application of this technology to landfill facilities is deemed feasible, though some additional research is required.
The location characteristics, which limit human access, are expected to be highly suitable for utilizing satellite SAR technology that can easily capture data remotely. This technology can be used not only for landfill facilities but also for other areas and structures that are difficult or dangerous for humans to access, facilitating easy maintenance. Thus, the technology of using satellite SAR data is well suited for landfill facilities.
Owing to the characteristics of landfill sites, trees can grow significantly. This vegetation can interfere with SAR data collection, causing errors in the analysis. In such cases, various methods can be applied to improve the reliability of the analysis. A scatter that can reflect the satellite SAR signals aligned with the orbit of the satellite could be installed. Installing scatterers would improve data reception and provide fixed points, enhancing reliability at landfill sites that lack such fixed points. As continuous subsidence can occur at landfill sites, research on various aspects, such as the optimal size, weight, and installation location for the landfill, is required to determine the best structure and placement.
Identifying the growth cycles of the vegetation and applying corrections based on that vegetation are other methods. In analyzing actual satellite data, a consistent annual vertical displacement pattern caused by vegetation could be observed. Additionally, vertical displacement patterns caused by ground expansion from temperature changes can also be observed. Monitoring data from a particular area over an extended period enables periodicity identification of these changes and the application of corrections.
To apply satellite SAR data to closed landfill facilities, the analysis must be cost-effective, considering that no revenue is generated from these sites. While several analysis tools are available both domestically and internationally, a reliable and free tool effectively minimizes analysis costs. Therefore, further research should find analysis tools suitable for landfill facilities, particularly among widely used noncommercial tools.
Finally, guidelines related to the use of the analysis results, such as risk assessment criteria and interpretation, should be developed by completing the analysis with a method suitable for landfill facilities. Considering that landfills have locations, ground conditions, landfill contents, and landfill depth, subsidence and displacement criteria should be assessed individually. However, because individual landfill management is difficult, a management plan that aligns with the domestic standards is required.
4. Conclusion
Observing regional areas using satellite SAR data is relatively easy. In this study, the areas in Korea where underground transportation infrastructure is being built were analyzed to validate the results of existing literature. Subsequently, this study discussed how this analysis can be applied to the maintenance of landfill facilities that are difficult to access owing to their regional areas. The conclusions are as follows.
(1) The analysis of subway construction in Gyeonggi Province revealed subsidence patterns after construction, with subsidence exceeding 20 mm observed at some points. In the case of the underground roadway in Busan, the vertical displacement was found to be within ±2.50 mm/year. For the landfill facility in Pohang, the vertical displacement values on the slope along the road direction ranged from (-)58 mm to (+)22 mm.
(2) Satellite SAR technology is well-suited for monitoring landfill facilities and other inaccessible or hazardous areas, providing a reliable method for satellite SAR data collection and maintenance.
(3) Since closed landfill sites generate no revenue, cost-effective analysis methods, such as free and reliable tools, should be prioritized to minimize expenses. There are many free tools for analyzing satellite SAR data, making them suitable for the task.
(4) Analyzing vegetation growth cycles and applying corrections for displacement patterns caused by vegetation or temperature induced ground expansion can enhance data accuracy. Further related research is required.
(5) Risk assessment criteria and analysis result interpretation guidelines should be developed, considering the unique characteristics of each landfill. A unified management plan aligned with national standards is necessary for effective oversight. If the technology is established and guidelines and standards are developed, efficient landfill facility management will become possible.
